
The problem
Reading LC-OCT scans by hand doesn't scale
One LC-OCT scan holds hundreds of cross-sections. Tracing the dermal–epidermal junction through each of them by hand is slow, and two readers rarely draw it the same way.

Hundreds of slices per scan
A single volume can hold around 500 B-scans. Reviewing them one at a time slows every study down.

Results vary by reader
Manual tracing depends on who does it, so the same scan can give different figures.

Figures without a record
When the settings behind a number aren't kept with it, results are hard to compare or repeat later.
How it works
Your lab measures. UNDULIX analyzes. You get the report.
UNDULIX comes in after your imaging. Nothing changes about how your team scans.
- 1
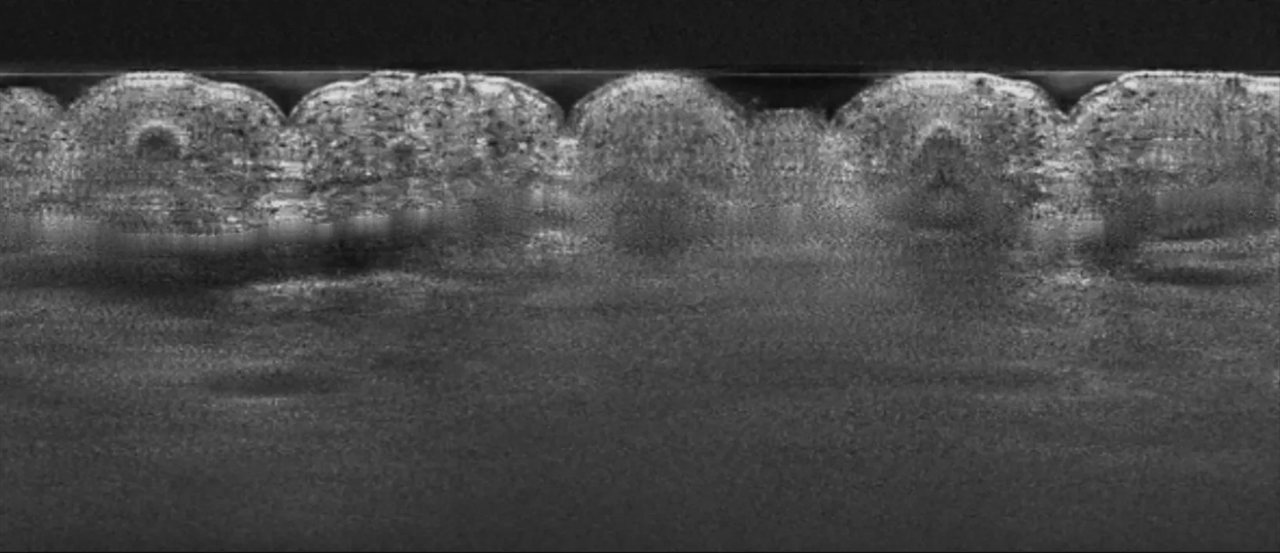
Your lab measures
Your team scans the study site with its own LC-OCT device, as it does today, and exports the volume as a .tif stack.
- 2
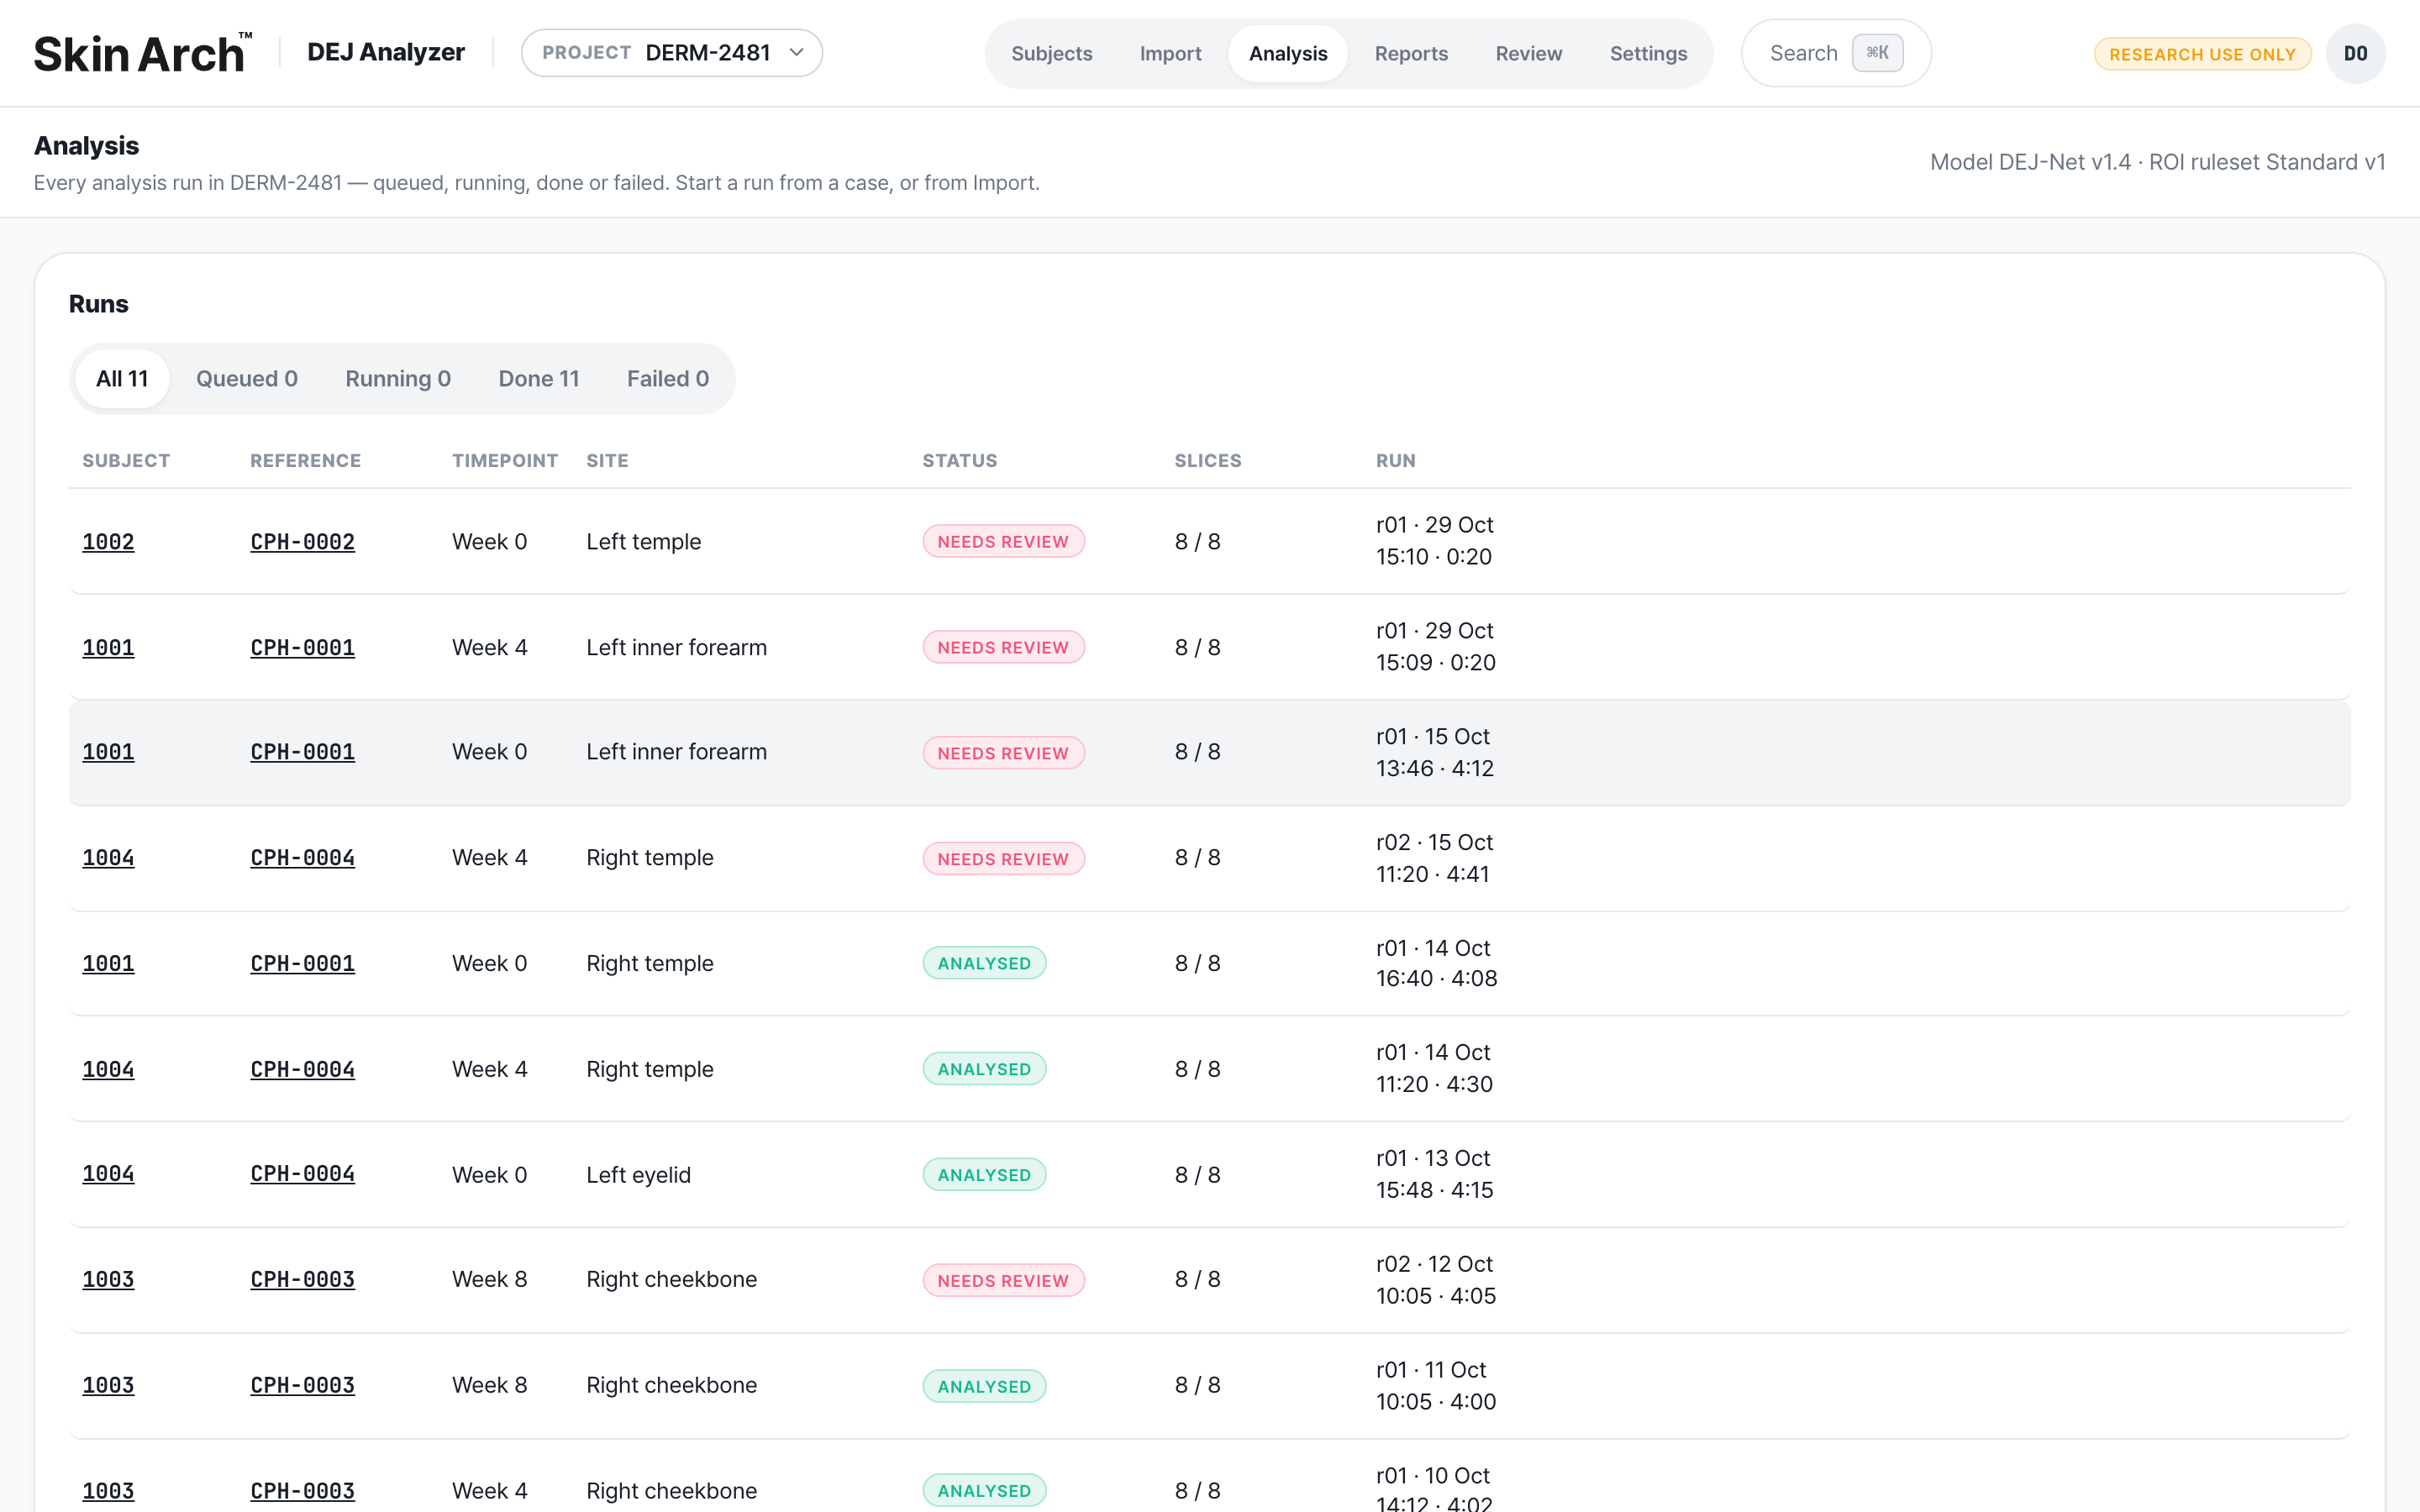
UNDULIX analyzes
Import the stack and run it with one click. The AI traces the junction slice by slice and flags where it is less certain.
- 3
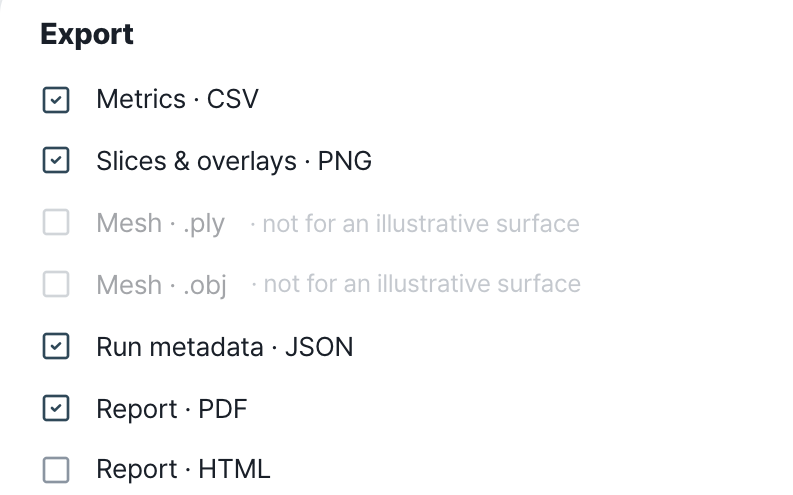
You get the report
Metrics, overlays, a 3D surface and a study report. Every export records the model version and settings used.
ⓘ Illustrative interface. All names, model names, figures and study data shown are placeholders.
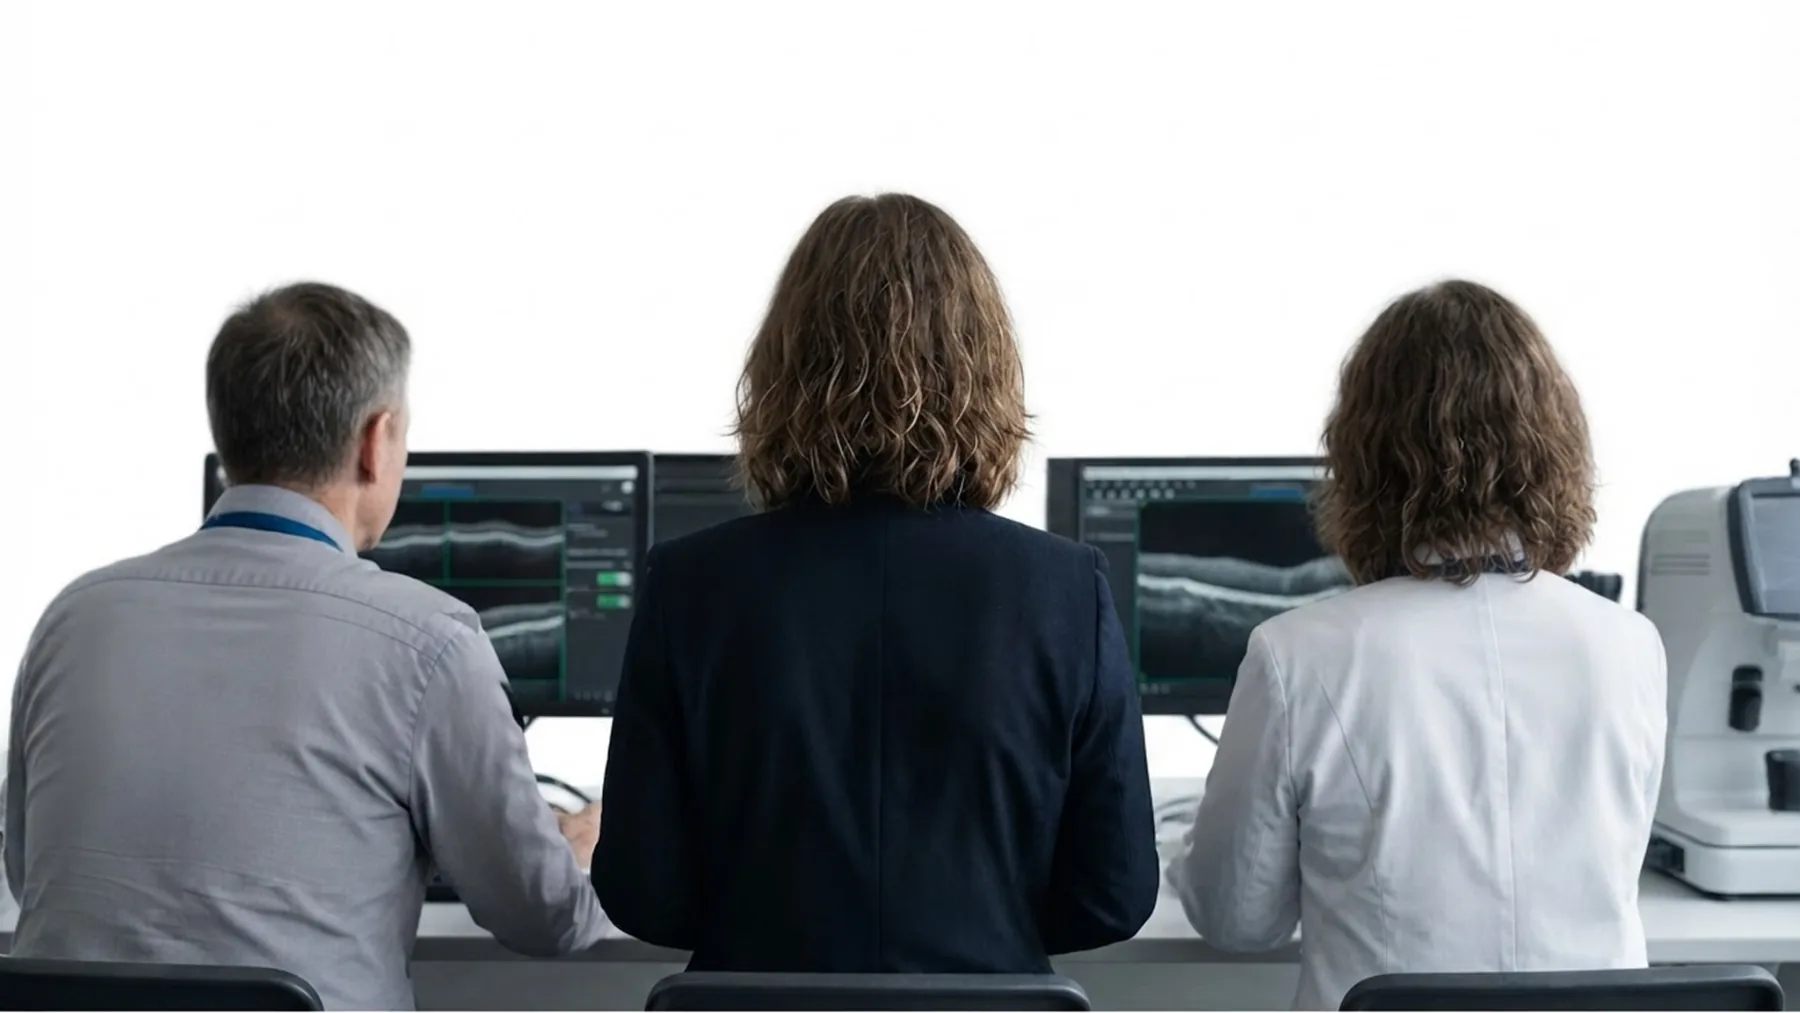

See the Invisible. Measure the Complex.
Start a research partnership
Tell us about your study and whether joint research or a PoC fits better. Our team replies by email.


Available for Windows and macOS
Prefer email? contact@wsoft.space